Resources & Support
Select a product below to view support articles, videos, manuals, and obtain the latest updates.
Specifications
| Accuracy | 5% |
| Display | Sunlight visible transflective LCD |
| Operating environment | 32°F – 113°F (0°C – 45°C); 0-90% relative humidity |
| Internal Battery | Rechargeable Lithium-Ion (5000 mAh) |
| Data Logging | Via integral SD card (32 GB) |
| Dimensions | 5½ in H x 8¼ in W x 10 in D (140 x 210 x 254 mm) Includes body and legs |
| Weight | 6.5 lb (2.95 kg) |
| Enclosure | Anodized aluminum |
| Power (when plugged in) | Universal AC outlet adapter. Rated voltage 100-240V, 50/60hz, USB A. Total output: 5V, 2400 mA or higher. |
| Calibration | Against standard gas mixture, or via Interscan’s SENSOR EXPRESS® |
ARTICLES
COMMON QUESTIONS
Our gas detectors come with a standard 1-year warranty, covering manufacturing defects and providing peace of mind for our customers.
Yes, our gas detectors meet or exceed industry standards and regulations for safety and performance, including those set by OSHA, ANSI, and other relevant organizations.
Interscan gas detection devices are designed for ease of use and minimal maintenance. The primary maintenance tasks are regular sensor replacements and battery checks. Additionally, it is important to keep the equipment clean and ensure it is operating correctly. Adhering to the manufacturer’s maintenance schedule is essential for consistent and reliable performance.
Most orders for sensors and parts can be shipped within the week. If you have a rush, please notify us!
Most sensors should be replaced every 3 months. This assumes proper maintenance and infrequent exposure to concentrations above the intended measuring range of the instrument. If your sensor is exposed to high concentrations of a gas, a replacement is recommended.
Yes. We do this to serve you better and more efficiently. Please request an RMA form here.
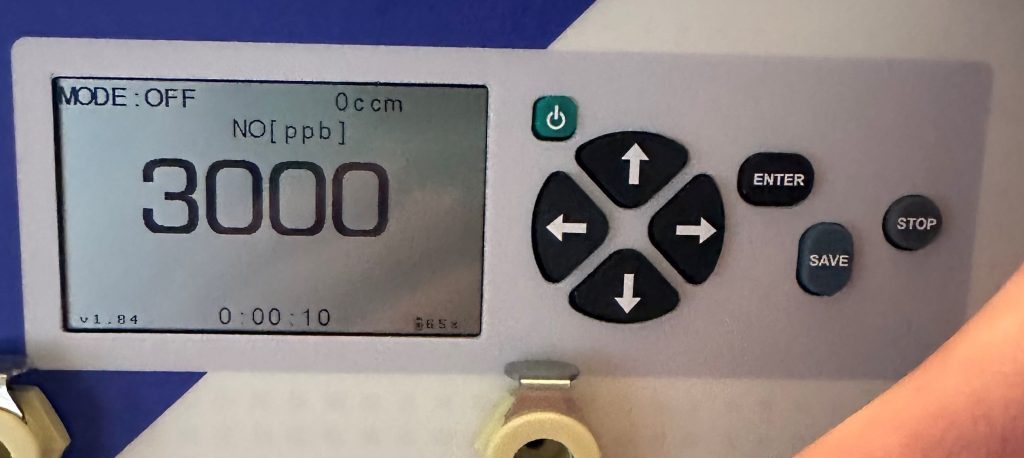
For accurate readings, the pump must be on while measuring. When you enter Measure-mode, the default is “Mode: Off “ (this means the pump is off) With measure mode “off”, it may appear like the instrument is measuring, but it is not measuring actually. (If the pump is off the display will read Mode: Off as shown below)
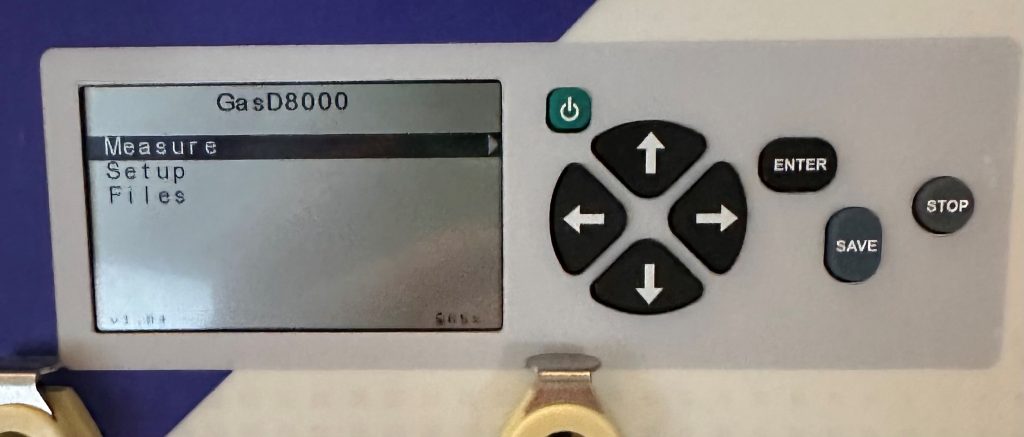
To turn the pump on, from main menu with MEASURE highlighted, press the Right Arrow and press Enter The display should read “Mode:On” and now your device is actively measuring. This is process should be used each time a measurement is taken. If pump was previously “off”, then once the pump is turned-on, the user can confirm that the instrument is measuring gas.
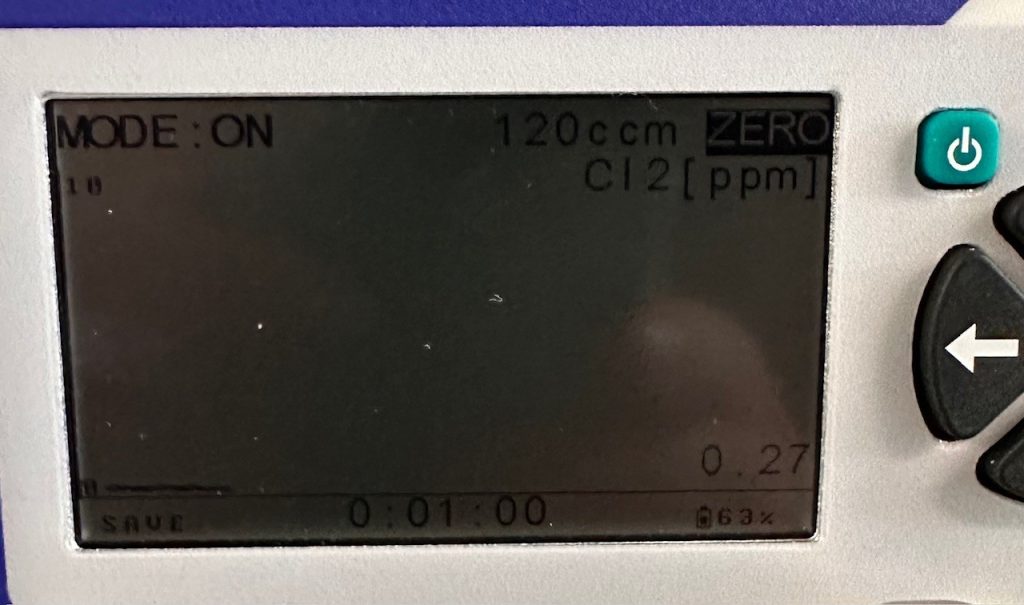
If the pump was turned on and the sampling mode is set to “CON” (See FAQs), but measurements are still reading Zero, it may be necessary to reset the zero on the device to restore measurement accuracy. (is possible that the zero was inadvertently reset while the instrument was stabilizing and thus measurement below that “new zero” will always read zero)
To reset zero : The instrument should be in an environment without any analytes, then power the instrument. Measure will be highlighted. Press the right-arrow and then press Enter. The instrument display should say “Mode:On”.
Let the instrument stabilize for 30 minutes.
After 30 minutes , press the up-arrow button to Highlight Zero and press Enter. This will establish a new zero for the instrument sensor.
Press the Stop button.
Expose instrument to the target gas to confirm the new zero is established and non-zero readings are present. (If your instrument is still reading zero, then please contact our technical support department)
From Main Menu, press the down arrow button to Setup. Then press the Right arrow button and the Sampling Mode should be set at CON (as shown below).
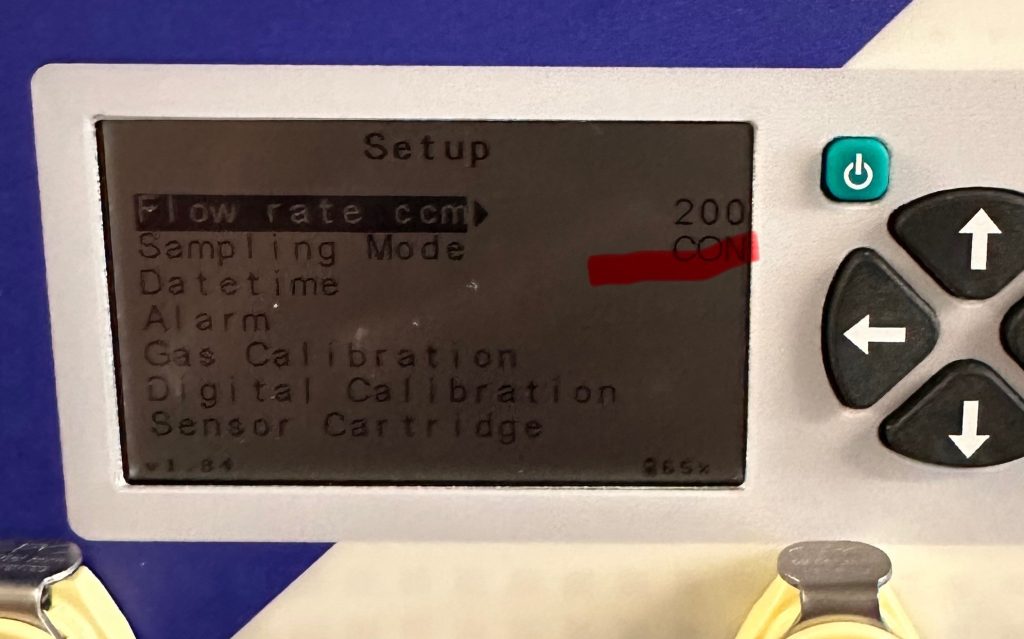
If the sampling mode is not set to “CON”, press the down-arrow to highlight Sampling Mode, then press the right-arrow. Then use the up and down arrow to scroll to highlight CON
Power off the instrument.
Power the instrument back on. Measure will be highlighted. Press the right-arrow and then press Enter The device should be begin measurement